📉 Punjab National Bank (PNB) Technical Analysis – May 7, 2025
Overview: A Strong Bearish Signal from the Charts
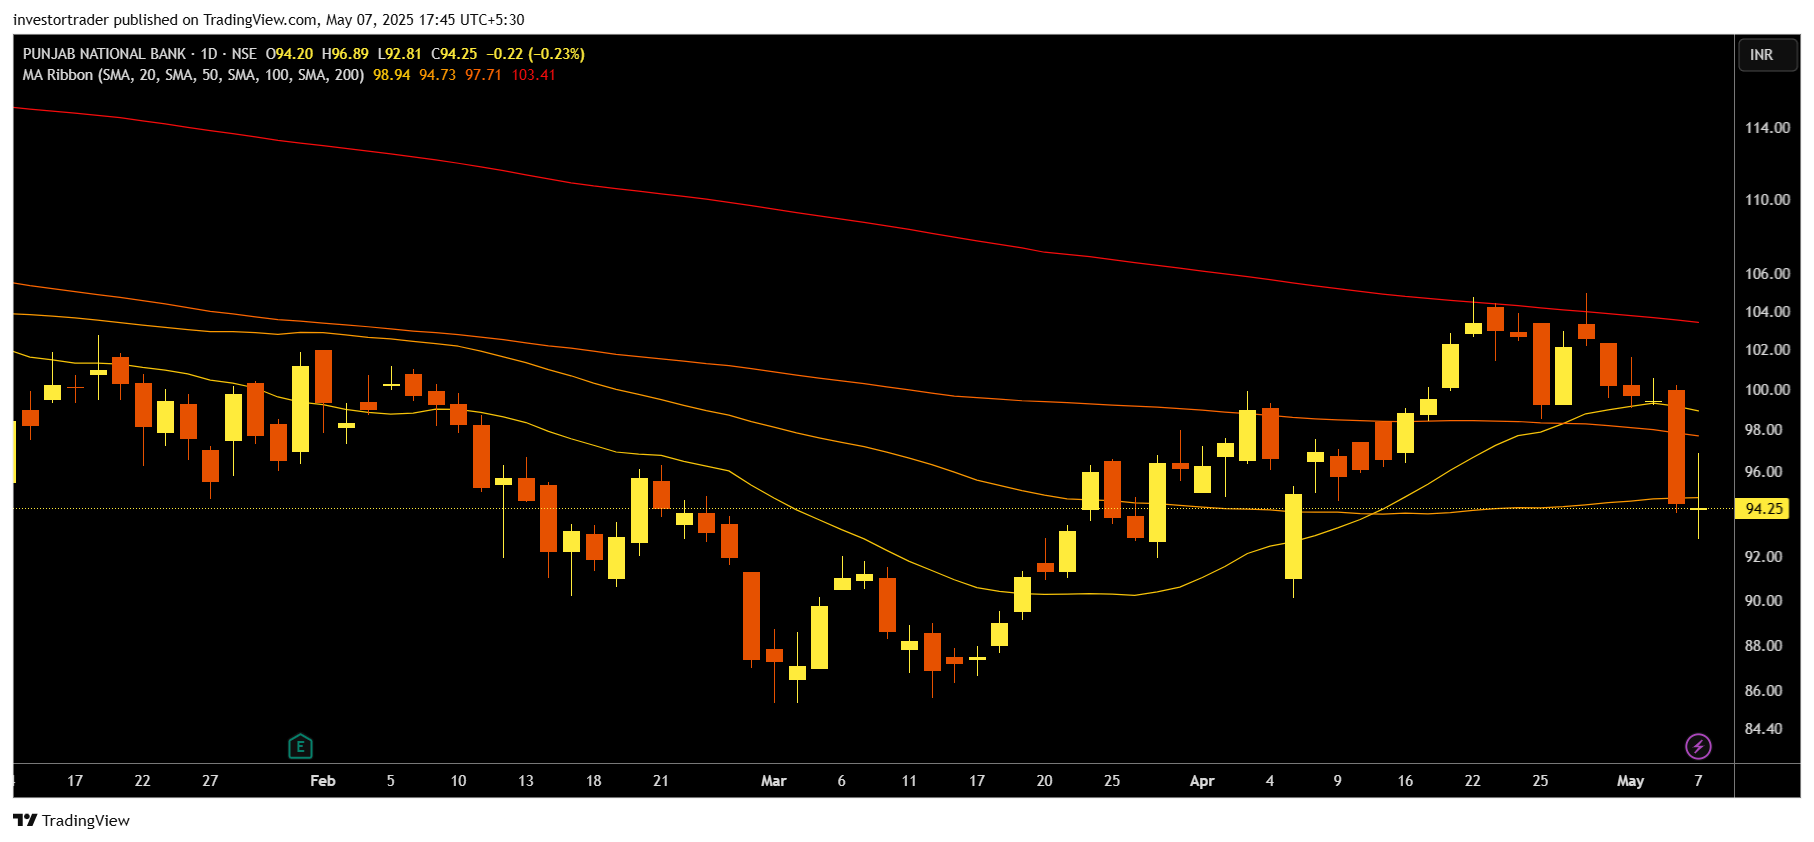
As of May 7, 2025, the technical landscape for Punjab National Bank (PNB) presents a strong bearish outlook. Leveraging a combination of moving averages, momentum oscillators, and trend indicators, the data signals a “Strong Sell” sentiment. While technical analysis doesn’t predict future prices, it provides key insights into current market momentum and investor behavior.
In this blog, we dive into PNB’s technical indicators, moving averages, and pivot points to understand what the charts are currently revealing. Please note: this is for educational and informational purposes only—not financial advice.
📊 Technical Indicator Summary
Technical indicators help assess a stock’s momentum, volatility, and trend direction. Here’s how PNB stacks up:
- Overall Technical Indicator Signal: Strong Sell
- Buy Signals: 1
- Neutral: 1
- Sell Signals: 7
Key Indicators at a Glance:
- RSI (14): 40.53 – Leaning toward Sell, indicating weakening momentum but not yet oversold.
- Stochastic (9,6): 45.82 – Neutral, suggesting indecisiveness among traders.
- StochRSI (14): 0 – Signaling Oversold, potential for price reaction.
- MACD (12,26): 0.76 – A rare Buy signal, reflecting slight bullish crossover.
- ADX (14): 25.38 – Moderate trend strength, but current direction favors sellers.
- Williams %R: -90.65 – Deep into Oversold territory.
- CCI (14): -198.38 – Sell, showing strong downward momentum.
- ATR (14): 3.09 – Indicates High Volatility, expect larger price swings.
- ROC: -2.68 – Suggests downward momentum.
- Bull/Bear Power (13): -7.40 – Bears clearly in control.
Despite one buy signal from the MACD and oversold readings in the Williams %R and StochRSI, the majority of indicators lean strongly bearish.
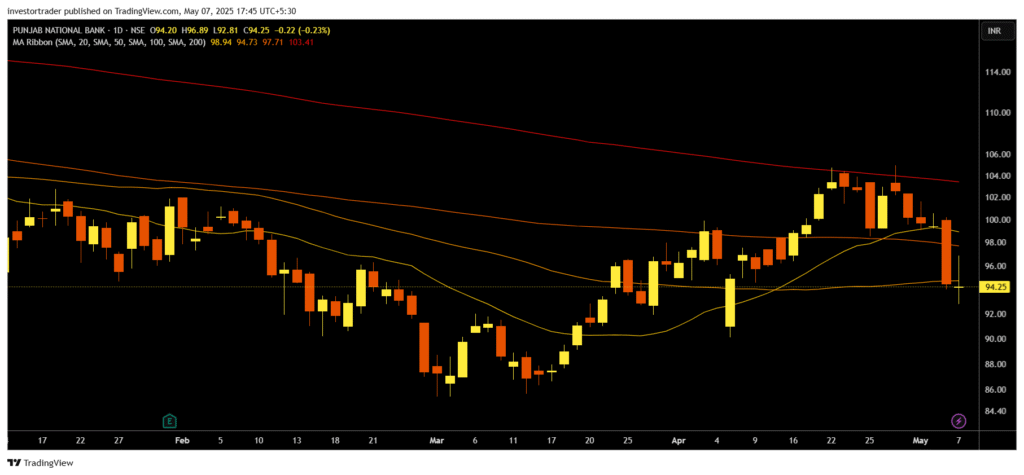
🧮 Moving Averages: Across the Board Sell
Moving averages are a classic tool to smooth out price data and identify trend direction. PNB’s chart shows consistent “Sell” signals across all short- and long-term averages.
| Period | Simple MA | Action | Exponential MA | Action |
| MA5 | 97.56 | Sell | 96.93 | Sell |
| MA10 | 99.76 | Sell | 98.15 | Sell |
| MA20 | 98.92 | Sell | 98.01 | Sell |
| MA50 | 94.73 | Sell | 97.20 | Sell |
| MA100 | 97.71 | Sell | 98.47 | Sell |
| MA200 | 103.41 | Sell | 101.04 | Sell |
The fact that both short-term (5–20 day) and long-term (50–200 day) averages signal “Sell” highlights the strength of the current downtrend.
📍 Pivot Points: Potential Support and Resistance Levels
Pivot points help traders spot potential support and resistance levels. Here are the key levels derived from different pivot models:
Classic Pivot Points:
- Support Levels: S1: 92.24 | S2: 90.02 | S3: 86.03
- Resistance Levels: R1: 98.45 | R2: 102.44 | R3: 104.66
Fibonacci Levels:
- Support: 93.86 (S1), 92.39 (S2)
- Resistance: 98.6 (R1), 100.07 (R2)
With current prices likely trending below or around the pivot level of 96.23, there’s limited bullish energy, reinforcing the cautious tone set by other indicators.
📘 Key Takeaways for Traders and Analysts
- The overall sentiment is bearish, with both momentum indicators and moving averages confirming downward pressure.
- Volatility is high, as indicated by ATR, which may lead to rapid price swings.
- Oversold signals from StochRSI and Williams %R hint at a potential short-term bounce, but there’s no confirmation of a reversal yet.
This combination of factors makes it an interesting time to monitor PNB closely, especially for those learning how to interpret technical signals. Whether you’re backtesting strategies or studying market behavior, PNB’s chart is a case study in a strong downward trend with high volatility.
📌 Final Word
While Punjab National Bank’s technical indicators currently scream “Sell,” always remember: technical analysis is a tool, not a crystal ball. It’s best used alongside fundamental analysis, market news, and broader economic insights.
Stay informed. Stay analytical. And always manage risk wisely.
Disclaimer
This analysis is for educational purposes and does not constitute financial advice. Investing in the stock market involves risks, and past performance is not indicative of future results. Please consult a certified financial advisor before making investment decisions.