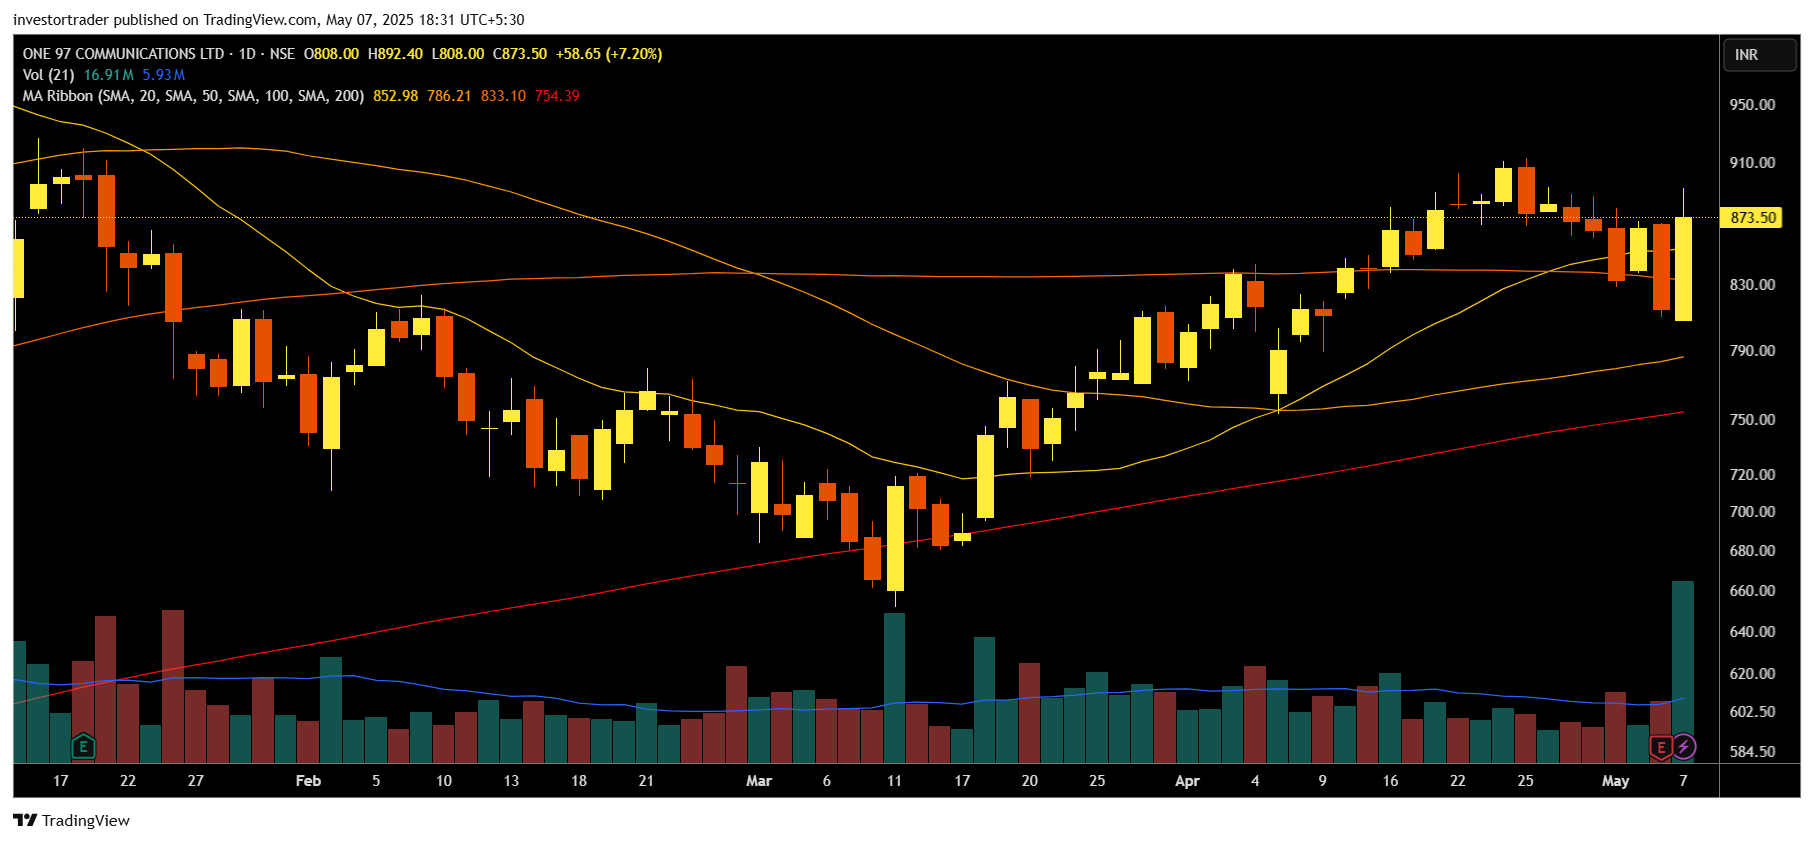
Paytm Stock Technical Analysis: A Strong Buy Signal Amid Mixed Indicators
In the fast-moving world of the stock market, understanding technical indicators is vital for making informed decisions. This blog post provides a comprehensive technical analysis of Paytm stock as of May 7, 2025, using a variety of key indicators and moving averages. Whether you’re a market enthusiast or someone learning the ropes of technical analysis, this post aims to educate and simplify the complex signals in play—without offering financial advice.
Overview: Strong Buy Indication from Most Indicators
As of the latest analysis, Paytm’s technical overview leans bullish with a “Strong Buy” rating. This signal emerges from a convergence of moving averages and momentum indicators, suggesting strength in the stock’s current trend.
Summary Snapshot:
- Overall Technical Summary: Strong Buy
- Moving Averages: Strong Buy (12 Buy, 0 Sell)
- Technical Indicators: Buy (5 Buy, 4 Sell, 2 Neutral)
Let’s break down what this means in a more detailed and digestible format.

Moving Averages: Consistent Bullish Momentum
Moving averages are often used to identify trend directions and potential reversals. In the case of Paytm, the data reveals that both simple and exponential moving averages (MA) are aligned in signaling a bullish trend.
| Period | Simple MA | Exponential MA | Signal |
| MA5 | 850.33 | 856.42 | Buy |
| MA10 | 866.96 | 855.99 | Buy |
| MA20 | 852.95 | 842.81 | Buy |
| MA50 | 786.20 | 826.41 | Buy |
| MA100 | 833.09 | 797.43 | Buy |
| MA200 | 754.40 | 763.49 | Buy |
Across all major time frames (5-day to 200-day), Paytm’s price is trading above its moving averages, a strong indicator of sustained upward momentum.
Technical Indicators: Mixed Signals With a Bullish Tilt
While the moving averages paint a clearly bullish picture, technical indicators tell a more nuanced story. Here’s how some of the key momentum and volatility indicators stack up:
- RSI (Relative Strength Index): 56.00 – Buy
RSI is in the neutral-to-bullish range, suggesting there is still room for upward movement before the stock becomes overbought. - MACD (Moving Average Convergence Divergence): 20.39 – Buy
The MACD’s positive value reflects bullish momentum. - ADX (Average Directional Index): 35.04 – Buy
A reading above 25 generally indicates a strong trend, and ADX confirms the strength of the current uptrend. - ATR (Average True Range): 38.15 – High Volatility
While this doesn’t directly signal buy or sell, it suggests that price movements are currently larger than usual—important for risk management. - Williams %R, ROC, and Bull/Bear Power: Mixed
Williams %R and ROC support the bullish narrative, but Bear Power indicates some underlying bearish pressure, possibly hinting at short-term volatility.
Pivot Points: Key Price Levels to Watch
Pivot points help identify potential support and resistance levels. Here are the classic pivot levels:
- Support Levels: S1: 793.44, S2: 772.02, S3: 733.94
- Resistance Levels: R1: 852.94, R2: 891.02, R3: 912.44
- Central Pivot: 831.52
Paytm’s current price appears to be hovering around the central pivot point, indicating a potential breakout or reversal could be on the horizon. Resistance near ₹852 and ₹891 will be critical thresholds to monitor.
Final Thoughts: Educational Takeaways
From a technical standpoint, Paytm stock shows a strong bullish sentiment, particularly driven by favorable moving averages and supportive momentum indicators. However, some short-term indicators present cautionary signs, which is typical in a volatile market.
Key Educational Insights:
- Confluence of Indicators gives stronger signals than any single metric.
- Moving Averages are especially useful for identifying trend direction.
- Volatility Metrics like ATR are vital for assessing risk levels.
- Pivot Points help traders plan entry and exit points based on support and resistance.
Disclaimer: This post is for educational purposes only and should not be interpreted as investment advice. Always conduct your own research or consult a financial advisor before making any investment decisions.