HPCL Stock Analysis: Why Technical Indicators Signal a Strong Buy
Are you tracking Hindustan Petroleum Corporation Limited (HPCL)? The latest technical analysis suggests a bullish trend for the stock. Here’s a comprehensive breakdown to help traders and investors make informed decisions.
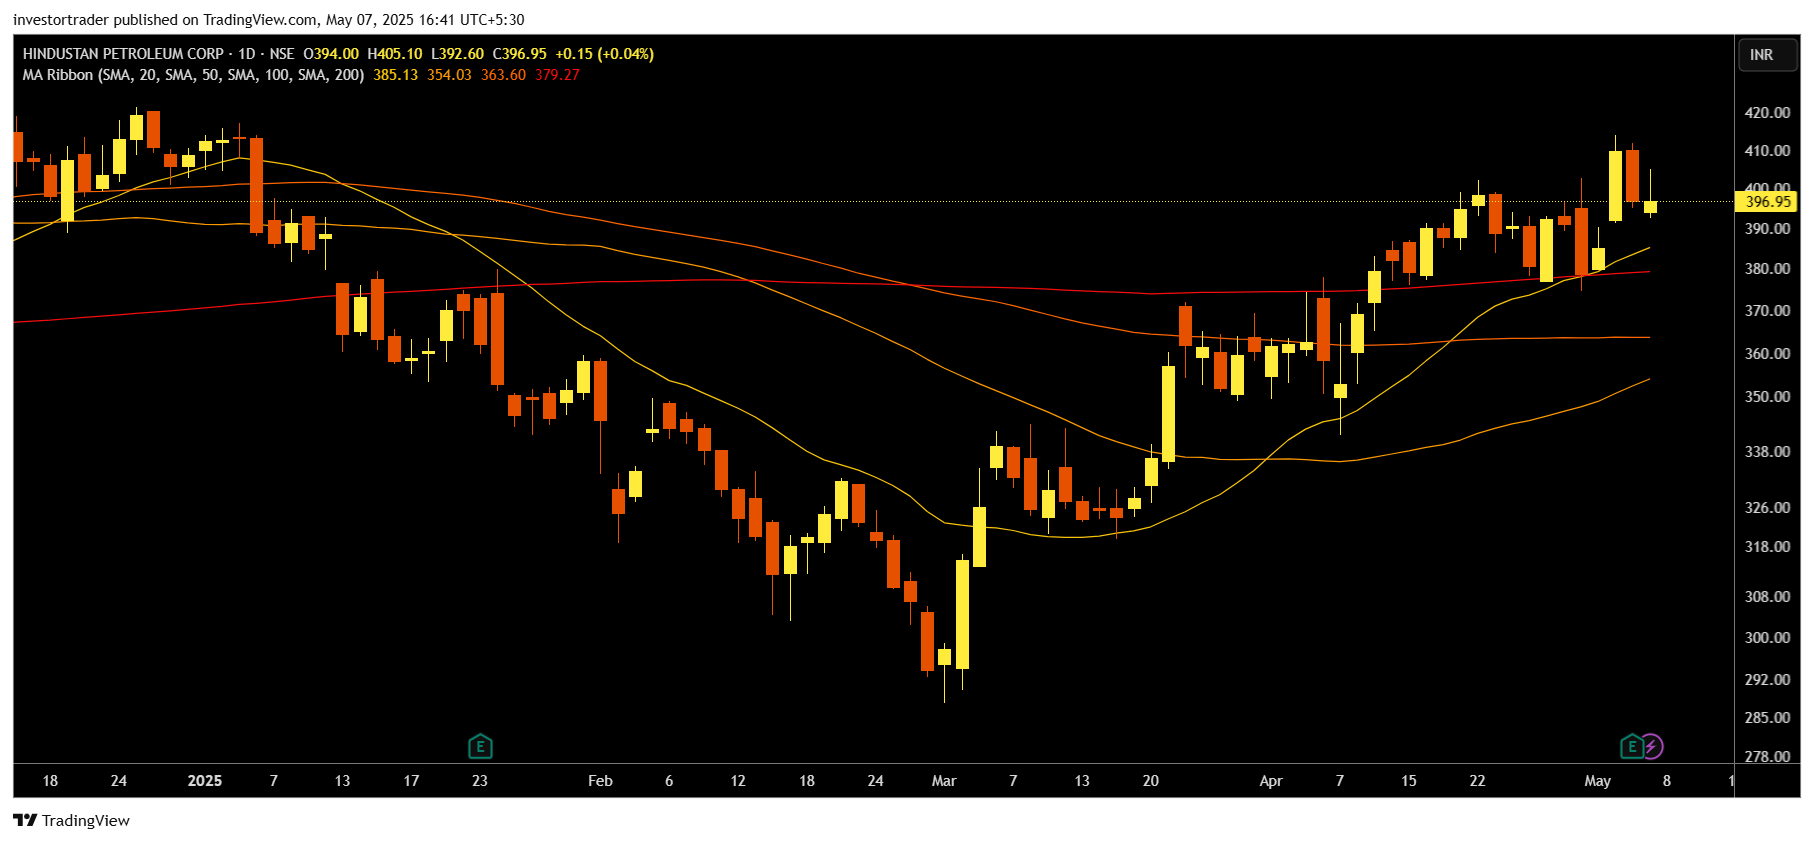
HPCL Stock: Summary of Technical Analysis
The technical indicators and moving averages for HPCL as of May 7, 2025, indicate a Strong Buy:
- Technical Indicators Summary: Strong Buy (7 Buy, 2 Neutral, 2 Sell)
- Moving Averages Summary: Strong Buy (12 Buy, 0 Sell)
This data suggests robust bullish momentum, making HPCL an attractive consideration for investors seeking growth opportunities.

HPCL: Key Technical Indicators Breakdown
- Relative Strength Index (RSI 14): 59.27 – Buy
Indicates moderately strong bullish momentum. - MACD (12,26): 12.12 – Buy
Bullish crossover signifies upward price momentum. - Commodity Channel Index (CCI 14): 100.37 – Buy
Validates strong upward price movement. - Rate of Change (ROC): 4.71 – Buy
Highlights a positive price acceleration. - Williams %R: -43.16 – Buy
Shows potential for further price growth.
While most indicators favor bullish sentiment, Stochastic RSI (14) and the Ultimate Oscillator suggest caution, signaling potential trend weakening.
HPCL Moving Averages: Strong Buy Across All Timeframes
- Short-Term MAs (5, 10, 20): Indicate consistent upward momentum.
- Long-Term MAs (50, 100, 200): Validate sustained bullish trends.
Key Levels:
- MA20 (Simple): ₹385.13
- MA200 (Exponential): ₹359.82
These levels reinforce HPCL’s strong support and resistance structure, making it a reliable prospect for medium- to long-term investors.
Pivot Points: Tracking Support and Resistance
- Pivot Level: ₹401.25
- Resistance Levels: ₹407.40, ₹418.00, ₹424.15
- Support Levels: ₹390.65, ₹384.50, ₹373.90
The pivot points provide a roadmap for potential breakout levels and pullback zones, crucial for short-term trading strategies.
Why HPCL Stock is Gaining Momentum
- Strong Technical Indicators: Multiple buy signals across momentum and trend indicators.
- Moving Average Alignment: All timeframes suggest continued upward price action.
- Lower Volatility: ATR (14) at 14.45 indicates stability, ideal for risk-averse investors.
Investor Takeaway: Is HPCL a Good Buy?
Based on technical analysis, HPCL demonstrates strong bullish momentum and robust support at key levels. While the stock seems poised for growth, monitoring indicators like Stochastic RSI and Ultimate Oscillator is essential to anticipate potential trend shifts.
Disclaimer
This analysis is for educational purposes and does not constitute financial advice. Investing in the stock market involves risks, and past performance is not indicative of future results. Please consult a certified financial advisor before making investment decisions. This content adheres to SEBI guidelines and avoids direct stock recommendations.
By staying updated with technical analysis, you can better navigate the stock market. Keep tracking HPCL for potential opportunities, and remember: informed decisions are the key to successful investing.