MRF Stock Technical Analysis – May 2025: Bullish Signals Dominate the Chart
When it comes to technical analysis, few stocks are currently generating as much bullish momentum as MRF Ltd. As of May 7, 2025, a deep dive into the key technical indicators paints a strongly bullish picture. While technical signals should never be used in isolation or construed as investment advice, they provide crucial insights into price momentum, investor sentiment, and potential turning points.
Let’s break down the technical landscape of MRF stock to better understand what the market is signaling.
📈 Technical Summary: All Green Lights
The consensus across both technical indicators and moving averages is a clear “Strong Buy”. According to the latest data:
- Technical Indicators: 6 Buy, 0 Sell, 0 Neutral
- Moving Averages: 12 Buy, 0 Sell
- Overall Summary: Strong Buy
This uniform alignment suggests a dominant upward trend, at least in the short to mid-term.
🧪 Key Technical Indicators – What’s Behind the Signal?
1. Relative Strength Index (RSI 14): 83.22
- Status: Overbought
The RSI crossing 70 typically suggests a security is overbought, and at 83+, MRF is deep into overbought territory. While this reflects strong momentum, it also indicates the stock may be due for a breather or short-term consolidation.
2. Stochastic Oscillators (STOCH & STOCHRSI): 95.59 & 100
- Status: Overbought
Both indicators are pointing toward extremely high levels. Traders often watch these zones closely for signs of possible pullbacks or corrections.
3. MACD (12,26): 6256.8
- Signal: Buy
The MACD continues to show bullish momentum, supporting the broader upward trend. A positive MACD value typically confirms strength in a rising market.
4. ADX (14): 70.83
- Status: Overbought
A high ADX (above 25) suggests a strong trend. At over 70, MRF is not just trending—it’s trending hard. While this confirms the strength of the current rally, extreme values can sometimes precede sharp volatility.
5. Williams %R: -0.68
- Status: Overbought
This momentum indicator reflects similar overbought conditions. Like RSI, it signals that prices might be due for a pause.
6. Commodity Channel Index (CCI 14): 153.54
- Signal: Buy
A CCI over 100 typically suggests strong buying pressure. MRF is comfortably above that level.
Other indicators such as ATR (Average True Range) suggest lower volatility, which may add confidence to trend traders looking for sustained movements.

📊 Moving Averages – The Foundation of Trend Analysis
All major Simple and Exponential Moving Averages from 5-day to 200-day are giving Buy signals. This is often considered a cornerstone of trend-following strategies.
Here are a few key values:
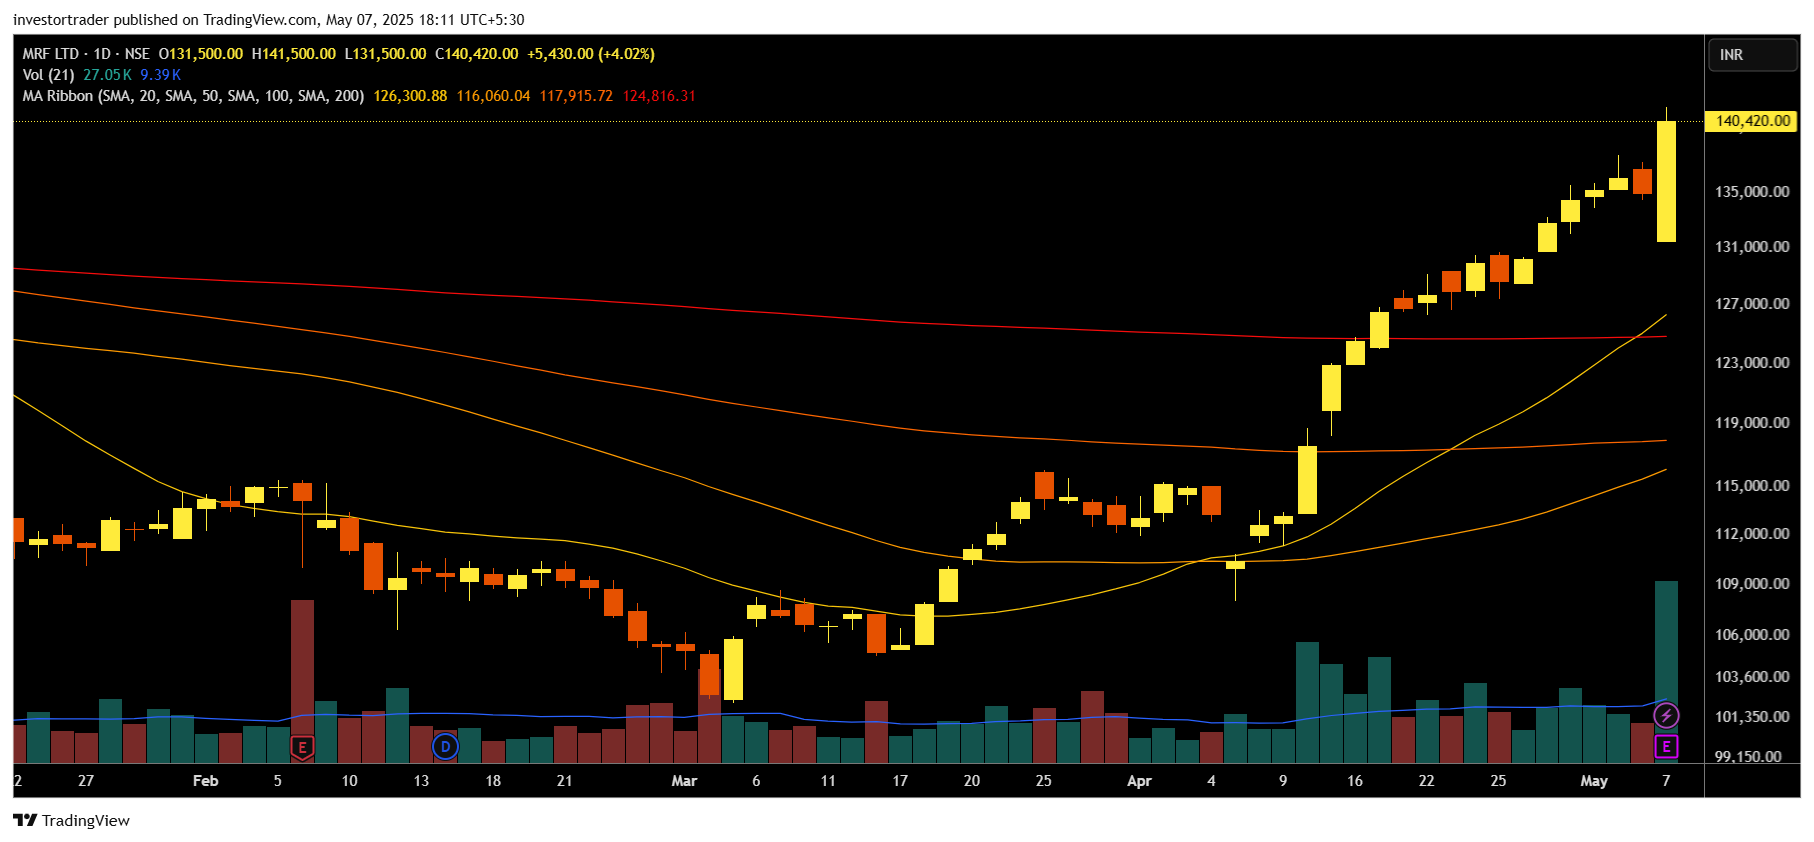
- MA20: 126,310 (Simple) | 127,907 (Exponential)
- MA50: 116,064 (Simple) | 121,358 (Exponential)
- MA200: 124,817 (Simple) | 121,998 (Exponential)
With MRF’s current price well above these averages, it indicates sustained upward momentum across multiple time frames.
🔢 Pivot Points – Mapping Support and Resistance
Understanding potential support and resistance levels helps traders manage entry and exit points:
- Classic Pivot Point: 135,586
- Resistance Levels (R1, R2, R3): 136,673 | 138,357 | 139,443
- Support Levels (S1, S2, S3): 133,903 | 132,817 | 131,133
These levels can act as psychological markers where price may react, consolidate, or reverse temporarily.
🧠 Educational Takeaway: How to Read Overbought Signals
Seeing multiple indicators in the “overbought” category doesn’t necessarily mean a reversal is imminent. In strong trends, stocks can stay overbought for extended periods. The key is to watch for divergences or volume drops that could signal weakening momentum.
📌 Final Thoughts
The current technical setup of MRF stock is overwhelmingly bullish, supported by strong momentum and favorable moving average trends. However, traders should always pair technical insights with broader market context and risk management practices.
Disclaimer: This post is for educational and informational purposes only. It does not constitute investment advice. Always consult a financial advisor before making trading decisions.